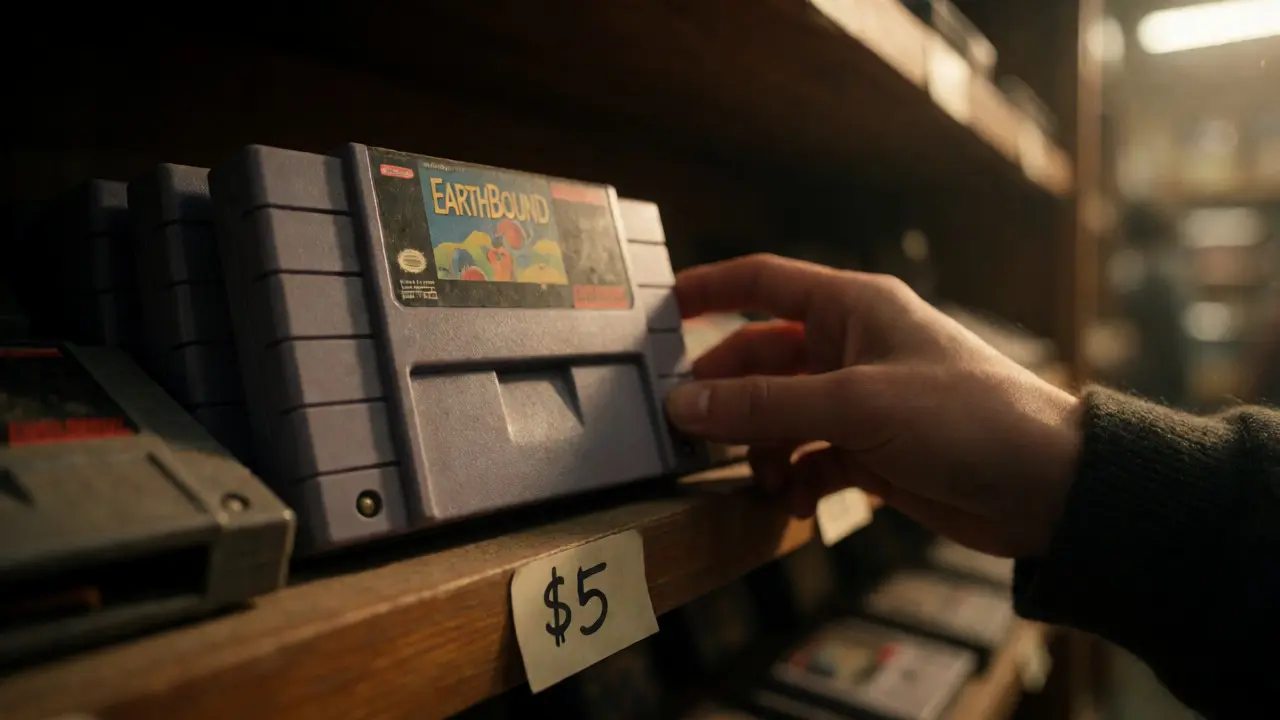
You walk into a thrift store in Portland and spot a copy of EarthBound for the Super Nintendo. It’s sitting on a shelf for $5. Your heart skips a beat. Is this a goldmine or a trap? Without data, you’re just guessing. But if you had a reliable SKU catalog that tracks historical sales prices, you’d know instantly that this specific title has averaged $150 over the last six months. That’s a $145 profit before fees. The difference between a hobbyist who loses money and a pro flipper isn’t luck; it’s access to accurate sales history.
Most new flippers make the fatal mistake of looking at current asking prices instead of sold listings. An eBay listing might show someone wants $200 for a game, but if nobody has bought one in three years, that price is fiction. You need real transaction data. This guide walks you through building a Stock Keeping Unit (SKU) catalog specifically designed for video game reselling, using actual sales history to predict margins, identify trends, and avoid dead stock.
Why Generic Spreadsheets Fail Game Flippers
A standard spreadsheet works fine for selling books or clothes, where each item is unique or easily categorized by ISBN or size. Video games are different. A single title can have dozens of variations: different regions (NTSC vs. PAL), editions (standard vs. collector’s), conditions (complete-in-box vs. loose), and even minor printing errors. If your catalog doesn’t distinguish between these, your sales history will be garbage.
Consider The Legend of Zelda: Ocarina of Time. There is a version with a red cartridge label (high value) and a version with a black label (lower value). If your spreadsheet lumps them together under "Zelda 64," your average price per unit becomes meaningless. You might think you’re making $50 profit when you’re actually losing money on the black-label copies while winning big on the red ones. A proper SKU system forces you to treat these as distinct entities.
Defining Your SKU Structure for Maximum Clarity
Your SKU needs to be more than just a barcode number. It should be a human-readable code that tells you exactly what the item is at a glance. For video games, a rigid structure saves time later when you’re analyzing data. Here is a proven format used by successful resellers:
- Platform Code: SNES, N64, PS1, NS (Switch)
- Title Abbreviation: ZELDA, MARIO, POKEMON
- Variation Identifier: RDLBL (Red Label), BLKLBL (Black Label), INTL (International)
- Condition Grade: CIB (Complete in Box), LOOSE, NEW
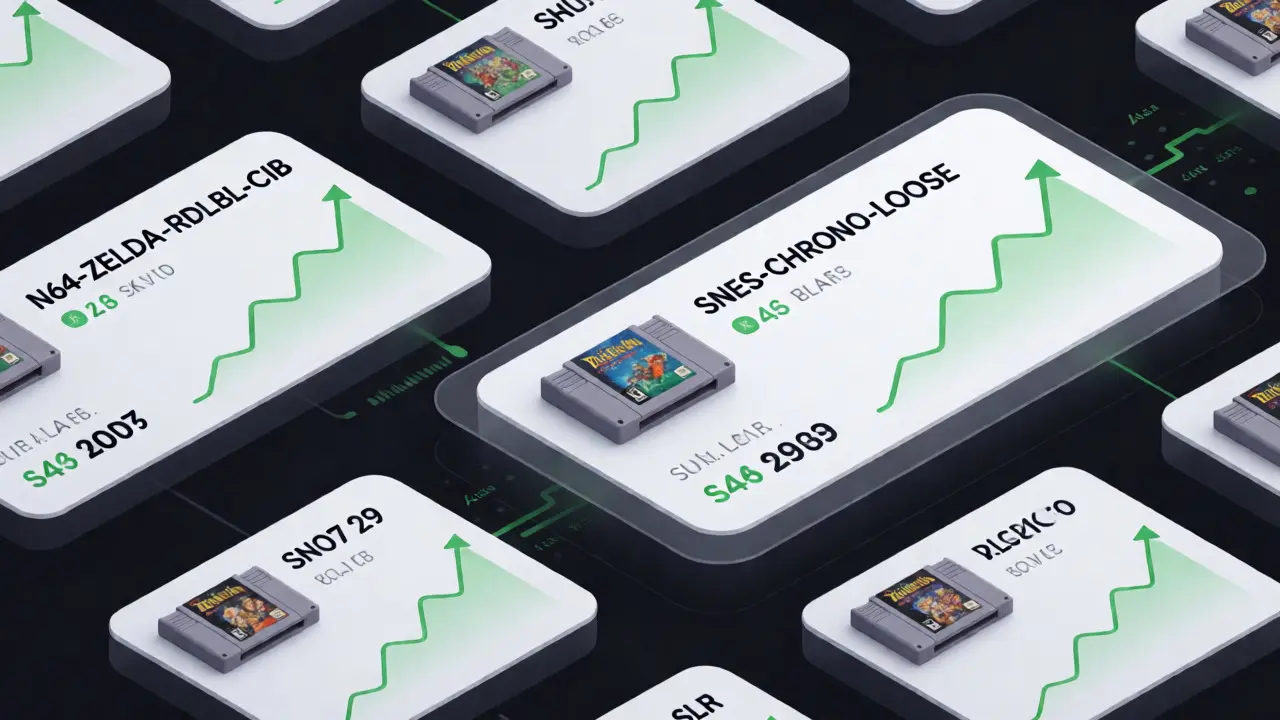
So, a complete-in-box red-label Zelda would be N64-ZELDA-RDLBL-CIB. When you export your sales history, you can filter by "N64" to see platform performance or by "CIB" to see if boxed copies are worth the extra storage space. This granularity allows you to answer questions like, "Do I really need to pay a premium for the box on PS1 RPGs?" with hard numbers.
Sourcing Reliable Sales History Data
You cannot build a catalog from thin air. You need external data sources to populate your baseline values. While you can track your own sales, you need market-wide context to set initial buying thresholds. Three primary tools dominate this space in 2026:
| Tool Name | Data Source | Best For | Cost Model |
|---|---|---|---|
| PriceCharting | eBay Sold Listings + Retail | Retro Collectors & Rare Games | Freemium / Subscription |
| Valuefence | Amazon FBA + eBay | Modern Consoles & Mass Market | Subscription |
| Terapeak | eBay Historical Data | Trend Analysis & Seasonality | Subscription (via eBay) |
PriceCharting is often the go-to for retro enthusiasts because it separates loose and complete prices clearly. However, its data can lag for modern titles. Valuefence excels here, pulling Amazon data which moves faster for popular Switch or PS5 games. Terapeak is powerful for seeing seasonality-like how horror games spike in October-but requires an active eBay seller account. Don’t rely on just one. Cross-reference them. If PriceCharting says a game sells for $20 and Valuefence says $15, check the last 10 sold listings manually on eBay to see which condition grades were sold.
Integrating Sales History into Your Decision Matrix
Once you have a tool, you need a rule for buying. This is where your personal sales history comes in. After you’ve flipped 50-100 units, you’ll notice discrepancies between third-party estimates and reality. Maybe you consistently sell PS2 games for 10% less than PriceCharting predicts because your photos aren’t professional enough. Or maybe you get a premium because you include free shipping.
Create a "Realized Margin" column in your catalog. Subtract all costs: acquisition price, shipping supplies, platform fees (usually 13-15%), and payment processing. Then compare this to the estimated market value. If your realized margin is consistently lower than the estimate, adjust your buy price down. If it’s higher, you can afford to pay more for inventory. This feedback loop turns your catalog into a living document that adapts to your specific selling style.
Identifying Trends Before They Peak
A static catalog shows you what happened. A dynamic one helps you predict what’s next. Look for anomalies in your sales history. Did a obscure PS1 RPG suddenly jump from $10 to $40 in two weeks? Check social media. Often, a viral TikTok or YouTube video about a "hidden gem" drives demand before the general market catches up. If your catalog flags a sudden velocity increase, buy aggressively.
Conversely, watch for decay. New console releases often kill interest in previous-gen hardware. When the PlayStation 5 launched, PS4 game prices didn’t crash immediately, but the velocity slowed. By tracking the number of days an item sits in your inventory, you can spot this trend early. If your average days-to-sale for Xbox One games rises from 14 to 45 days, stop buying new stock and liquidate what you have. Your SKU catalog should alert you to these shifts automatically if you tag items with acquisition dates.

Common Pitfalls in Catalog Maintenance
The biggest enemy of a good catalog is laziness. It’s tempting to skip entering the sale details because you’re busy packing boxes. But missing data skews your averages. Another common error is ignoring regional differences. A European Wii game might look cheap on PriceCharting, but if you don’t specify the region in your SKU, you might accidentally buy a US version thinking it’s the cheaper import. Always verify the product code (e.g., SLUS-xxx for US, SLES-xxx for Europe) and include it in your notes field.
Also, beware of "phantom" listings. Sometimes a game appears to have high sales volume because a seller is dumping 50 copies at once. This distorts the average price. Filter your data to exclude bulk sales if possible, or manually adjust outliers. Your goal is to understand the organic retail price, not the wholesale dump price.
Practical Example: Building a Entry for 'Chrono Trigger'
Let’s say you find a loose Chrono Trigger for SNES at a garage sale for $20. Here’s how you process it through your catalog:
- Check External Data: PriceCharting lists loose Chrono Trigger at $80-$100. Recent eBay sales show 5 units sold in the last week averaging $95.
- Calculate Costs: Buy ($20) + Shipping Supplies ($2) + eBay Fees (~$15 on $95 sale) = Total Cost $37.
- Determine Profit: $95 - $37 = $58 potential profit.
- Assess Risk: Is the cartridge tested? Does it save properly? If yes, buy. If no, negotiate down to $10 to cover repair risk.
- Log in Catalog: SKU: SNES-CHRONO-LOOSE. Date Acquired: Sept 7, 2026. Buy Price: $20. Est. Sell: $95.
This simple workflow takes two minutes but prevents costly emotional purchases. Over time, you’ll see patterns emerge. Maybe you realize you only ever sell loose cartridges for SNES RPGs, never complete ones, because collectors want mint condition and casual buyers don’t care about boxes. That insight lets you ignore complete copies unless they’re dirt cheap, freeing up capital for better flips.
Frequently Asked Questions
How many sales records do I need before trusting my own catalog?
You generally need at least 30-50 transactions per category (e.g., PS2 games) to establish a reliable baseline. Below that, your data is too noisy. Until then, rely heavily on external tools like PriceCharting or Terapeak for pricing decisions.
Should I use a database software or a spreadsheet for my SKU catalog?
For beginners, Excel or Google Sheets is sufficient. Once you exceed 500 SKUs, consider a dedicated inventory management tool like Veeqo or Sellbrite, which can integrate directly with eBay and Amazon APIs to automate sales history imports.
What is the best way to handle condition grading in sales history?
Never mix conditions in your average price calculation. Create separate rows or tags for "Loose," "Box Only," "Manual Only," and "CIB." A loose game might sell for $10, while the same title in CIB condition could fetch $50. Mixing them creates a misleading average.
How does shipping cost affect my SKU profitability analysis?
Shipping is a variable cost that must be deducted from every sale in your history. Use flat-rate shipping estimates based on weight and zone. If a game weighs over 1lb, it crosses a shipping tier threshold, significantly impacting margins. Tag heavy items in your SKU to flag them for review.
Can I use sales history to predict future price increases?
Yes, but with caution. Look for consistent upward trends over 6-12 months rather than short-term spikes. Also, monitor news cycles; announcements of remakes or new sequels often cause original versions to rise in value temporarily before stabilizing.