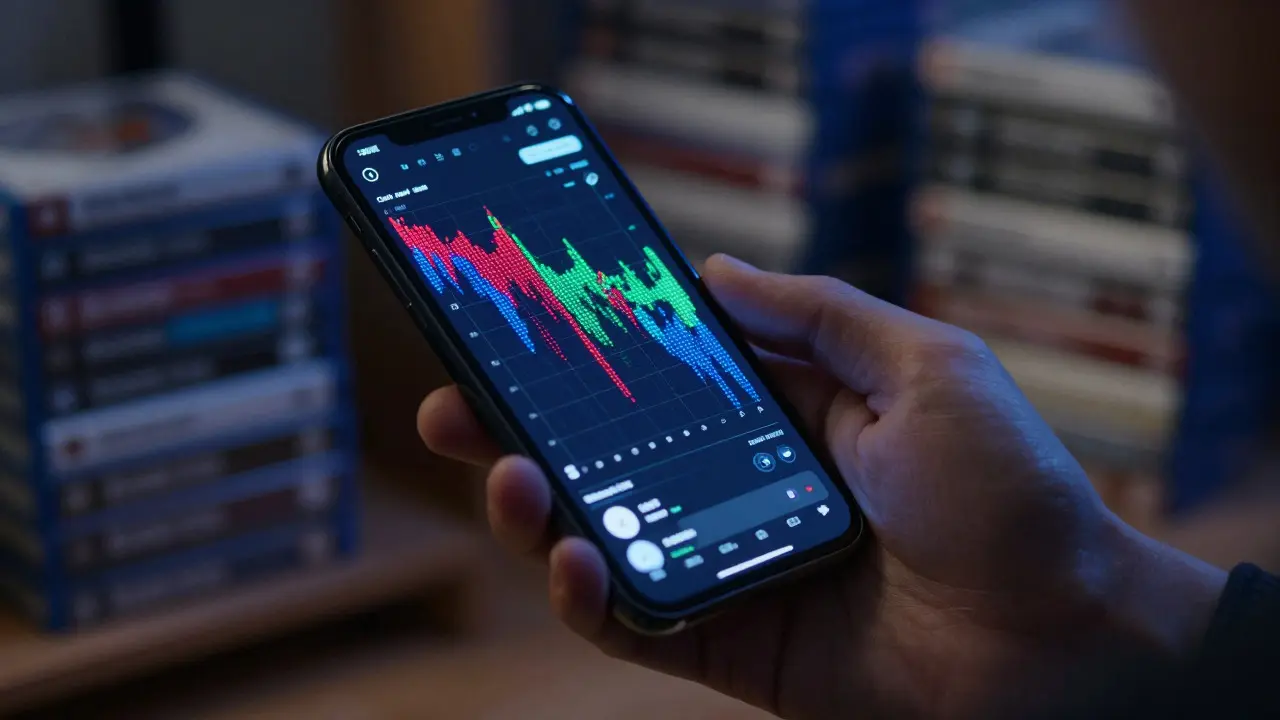
Most people think finding a good deal on video games requires luck or being the first one in line at a launch event. But the real money in video game flipping isn't made by guessing; it's made by watching the data. If you are still relying on gut feelings to decide which titles to buy from estate sales or online auctions, you are likely leaving profits on the table. The modern approach uses digital tools to track market movements in real-time, turning what used to be a chaotic search into a systematic process.
This guide breaks down how to use heatmaps and automated alerts to identify undervalued assets before the market corrects itself. We will look at the specific metrics that matter, how to interpret visual data, and how to set up a workflow that saves you hours of manual checking every day.
Why Gut Feelings Fail in Game Reselling
The video game market is volatile. A title that was selling for $40 last month might drop to $15 due to a new discount sale, or spike to $80 because a sequel announcement caused panic buying among collectors. Relying on memory or general knowledge about a franchise's popularity is risky. You might buy a game that seems popular but is actually saturated with stock, or miss a niche title that is quietly rising in value.
Data removes the emotion from the equation. Instead of asking "Do I like this game?", you ask "What is the trend velocity of this SKU over the last 30 days?" This shift in mindset allows you to target specific opportunities rather than browsing aimlessly. It transforms sourcing from a hobby into a business operation where every purchase has a calculated risk-reward ratio.
Understanding Price Heatmaps
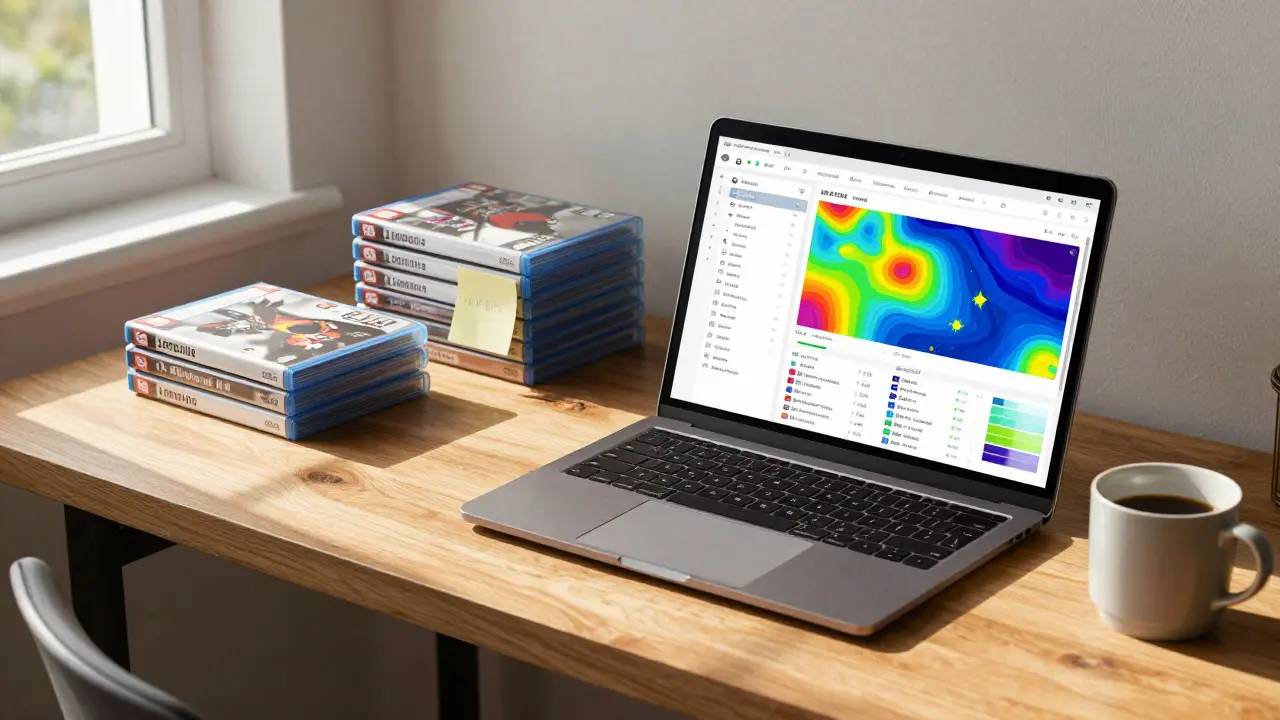
A price heatmap is a visual representation of market activity. Think of it as a weather map for your inventory targets. In these tools, colors indicate price movement or volume intensity. Typically, red indicates high demand or rapid price increases, while blue indicates cooling markets or price drops. Green often represents stable, healthy trading volumes.
When you open a heatmap dashboard, you are looking for anomalies. For example, if a mid-tier RPG from 2024 suddenly turns bright red on a Tuesday morning, something happened. Maybe a streamer just played it live, or a rare variant was spotted on an auction site. Your job is not to react to every color change, but to filter for significant shifts in categories you understand well.
- Red Zones: High volatility. Prices are moving fast. Good for quick flips if you can source cheap, but risky if you buy at the peak.
- Blue Zones: Low activity or price drops. These are potential bargain bins, but only if the drop is due to temporary oversupply rather than permanent devaluation.
- Green Zones: Stable markets. These are safer for long-term holding or slow-moving inventory, but they rarely offer immediate profit margins.
The key skill here is pattern recognition. Over time, you will start to see that certain genres heat up during specific seasons. Horror games often spike in October. Sports titles cool down after the major league season ends. Recognizing these cycles helps you anticipate moves before they appear on the screen.
Setting Up Effective Inventory Alerts
Heatmaps show you the big picture, but alerts give you the precise moment to act. An alert system monitors specific SKUs (Stock Keeping Units) and notifies you when conditions change. However, setting up too many alerts leads to notification fatigue, where you stop paying attention because the phone buzzes too often.
To build an effective alert strategy, focus on three types of triggers:
- Price Thresholds: Set an alert for when a game drops below a specific dollar amount. This is crucial for grabbing mispriced items on online marketplaces. For instance, if a collector's edition usually sells for $60, set an alert for $45. When it hits, you know it's an anomaly worth investigating immediately.
- Velocity Spikes: Monitor the number of units sold per week. If a game goes from selling 2 units a week to 10 units a week, demand is surging. This is often a leading indicator of a price increase. Buy now, sell later.
- New Listing Detection: Some platforms allow alerts for when a specific item appears in a local area. This is vital for local flippers who want to beat other buyers to physical copies at estate sales or garage sales listed on community boards.
Keep your alert list curated. Aim for 20 to 50 high-potential SKUs rather than tracking every game you own. Quality over quantity ensures that when your phone pings, it's for a genuine opportunity.

Integrating Data with Local Sourcing
Digital data is powerful, but you still need physical goods to flip. How do you connect online heatmaps to offline hunting? You use the data to create a "wish list" for your next thrift store run or yard sale trip. Before you leave the house, check your heatmap. Which genres are heating up? Which specific titles are showing blue zones (low prices) but have high historical demand?
If your heatmap shows that retro handhelds are trending upward, prioritize those sections in stores. If alerts indicate that a specific 90s RPG is seeing increased sales velocity, keep an eye out for that title in any bin you browse. This targeted approach means you spend less time digging through irrelevant boxes and more time evaluating potential winners.
Additionally, cross-reference online prices with local finds. If a game is selling for $30 online but you find a copy for $5 locally, that is a clear arbitrage opportunity. The data confirms the value; the local hunt provides the asset. Without the data, you might skip the $5 game because you don't know its true market value. With the data, you know exactly how much margin you are walking away with.
Common Pitfalls in Data-Driven Sourcing
Even with the best tools, mistakes happen. One common trap is chasing the red zone. Just because a price is spiking doesn't mean it will continue to rise. Often, spikes are short-lived reactions to news. If you buy at the peak of a spike, you are left holding inventory that may crash back to normal levels within weeks. Always look at the 30-day average, not just the current moment.
Another pitfall is ignoring condition variance. Data tools usually track the average price of a game, but they don't always distinguish between a sealed copy and a loose cartridge. A sealed game might be worth twice as much as a loose one. Ensure you are comparing apples to apples. If the data says a game is worth $50, but you are buying a loose copy that typically sells for $25, your margin is half of what the tool suggests.
Finally, don't neglect shipping costs and platform fees. A profitable flip on paper can become a loss once you factor in eBay fees, PayPal processing, and shipping supplies. Build these costs into your minimum acceptable bid. If the data shows a potential profit of $10, but fees eat up $8, you are only making $2 for your time. That might not be worth the effort unless it's part of a bulk strategy.
| Feature | Manual Sourcing | Data-Driven Sourcing |
|---|---|---|
| Decision Basis | Personal interest, memory, intuition | Real-time price trends, sales velocity, volume |
| Time Efficiency | Low (requires extensive browsing) | High (alerts notify you of opportunities) |
| Risk Level | High (buying without verified value) | Moderate (based on historical data patterns) |
| Scalability | Poor (limited by human attention span) | Good (can monitor hundreds of SKUs simultaneously) |
| Required Tools | None (just eyes and ears) | Marketplace APIs, heatmap software, alert apps |
Building Your Daily Workflow
Consistency is key to success in flipping. You don't need to stare at screens all day. Instead, establish a routine. Start your day by reviewing your heatmap dashboard for 10 minutes. Note any significant color changes in your tracked categories. Next, check your alert notifications. Did any prices drop below your thresholds? Did any velocity spikes occur?
Based on this review, update your shopping list for the day. If you plan to visit a local flea market, bring your phone with access to your data tools. When you find an item, quickly verify its current market value. If the numbers align, make the purchase. If not, move on. This disciplined approach prevents impulse buys and ensures that every dollar spent is backed by evidence.
At the end of the week, review your performance. Which data points led to successful flips? Which alerts were false positives? Adjust your thresholds and tracked SKUs accordingly. This feedback loop refines your strategy over time, making you sharper and more profitable with each passing month.
Frequently Asked Questions
What is the best tool for tracking video game prices?
There is no single "best" tool, as it depends on your preferred marketplace. Most serious flippers use a combination of built-in seller dashboards from major auction sites and third-party analytics platforms that aggregate data across multiple sources. Look for tools that offer API access or exportable CSV files so you can analyze trends independently.
How often should I check my heatmaps?
For most casual flippers, checking once or twice a day is sufficient. However, if you are targeting highly volatile items like limited-edition releases or competitive sports games, you may need to check more frequently. Automated alerts help reduce the need for constant manual monitoring.
Does data work for physical media only, or does it apply to digital games too?
While data applies to both, physical media offers clearer signals for flipping because supply is finite and condition varies. Digital games have infinite supply and instant resale, making price fluctuations smaller and harder to capitalize on for individual sellers. Physical copies remain the primary vehicle for high-margin flipping.
How do I know if a price drop is a good buy or a sign of declining value?
Look at the context. If the drop coincides with a massive influx of new listings, it might be temporary oversupply. If the drop happens alongside decreasing sales velocity, the game might be losing relevance. Cross-reference with community sentiment and upcoming releases to make an informed decision.
Can beginners use data-driven strategies effectively?
Yes, but it takes time to learn how to interpret the data. Start by tracking a small number of games you already know well. Compare the data predictions with actual outcomes. As your accuracy improves, expand your watchlist. Beginners often make the mistake of trusting the data blindly without understanding the underlying market dynamics.