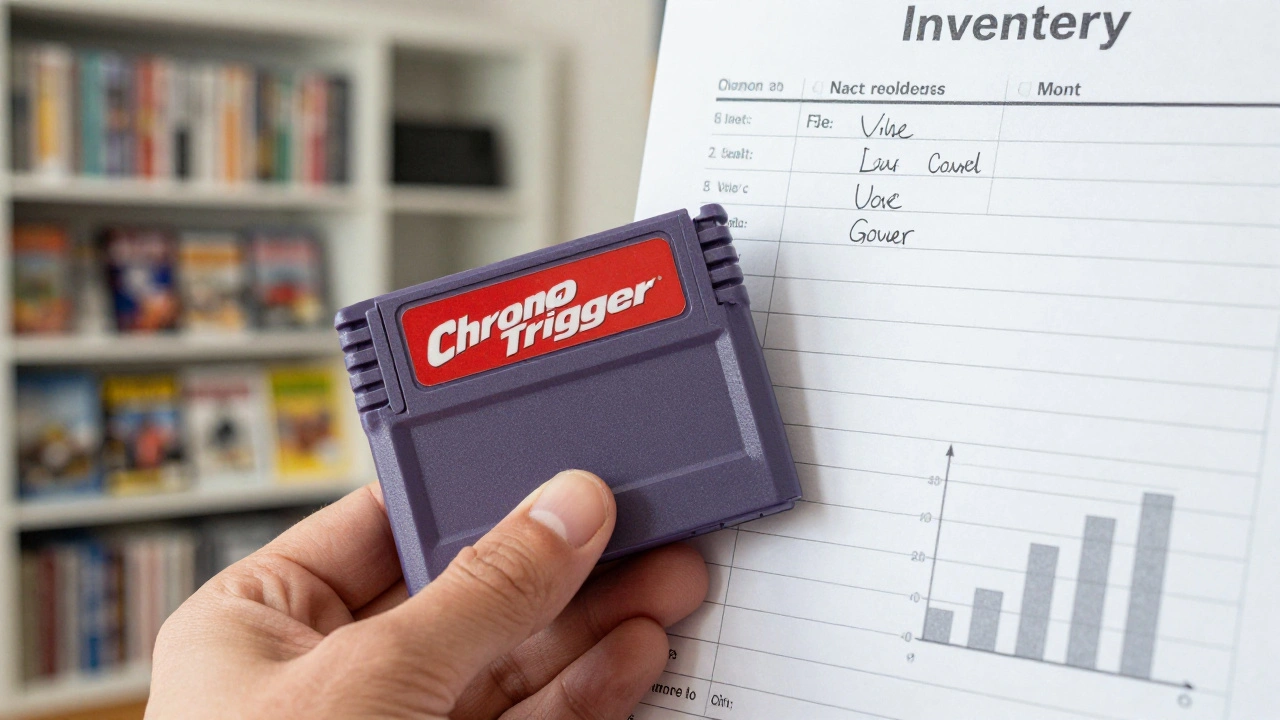
You bought that rare copy of Chrono Trigger three years ago. You remember the price tag was steep, but do you remember exactly what you paid? More importantly, do you know what it’s worth today? If your answer is "I have no idea," you are losing money-and peace of mind.
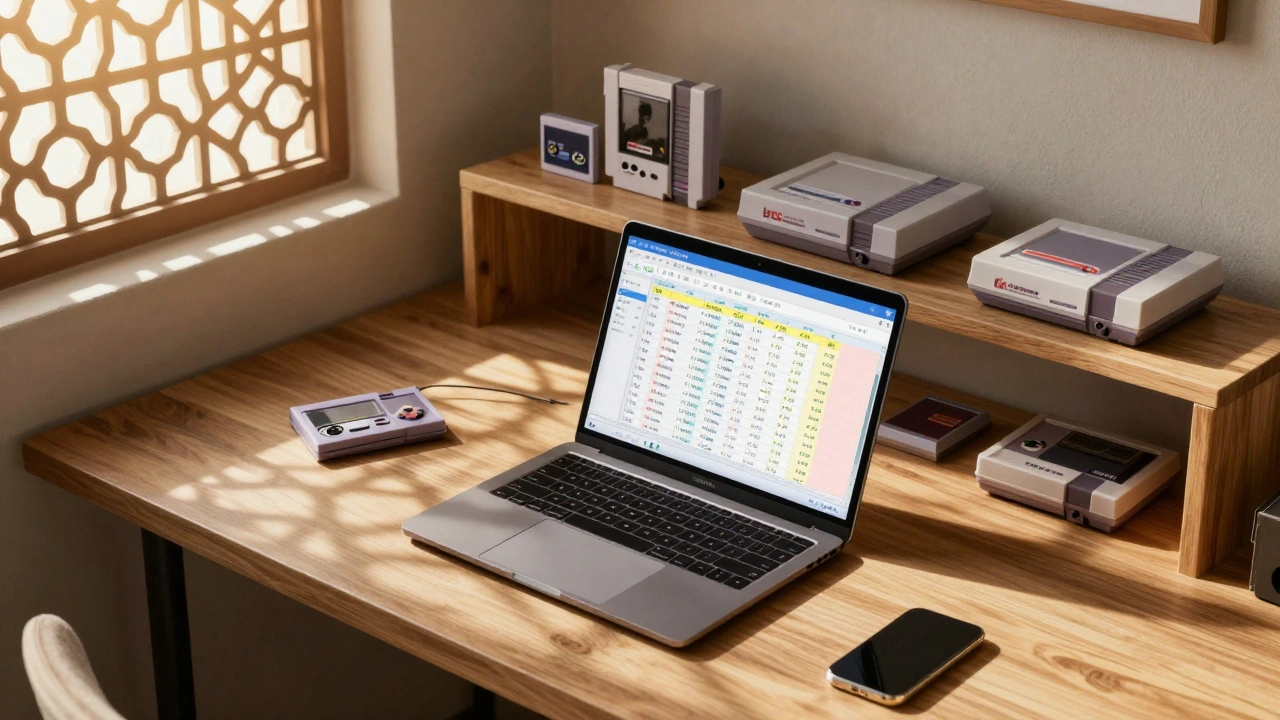
Tracking a video game collection isn’t just about hoarding nostalgia. It’s about asset management. Whether you want to sell a few titles to fund new purchases, insure your shelf against disaster, or simply stop buying duplicates, a manual mental list won’t cut it. The most flexible, powerful tool for this job isn’t a fancy app; it’s a simple spreadsheet.
Building a video game collection inventory in a spreadsheet gives you total control over your data. Unlike dedicated apps that lock your information into their ecosystem, a spreadsheet lives in an open format (like CSV or XLSX) that you own forever. In this guide, we’ll walk through how to build one from scratch, automate value tracking, and use formulas to analyze your spending habits.
Why Spreadsheets Beat Dedicated Apps
You might wonder why you should bother with rows and columns when apps like CLZ Games or Backloggery exist. Those tools are great for quick barcode scanning, but they often lack depth. They treat every game as a static entry. A spreadsheet treats every game as a data point in a financial portfolio.
Here is the reality: proprietary apps can shut down. Servers go offline. Subscriptions expire. Your data becomes inaccessible. With Microsoft Excel, Google Sheets, LibreOffice Calc, or Apple Numbers, your data stays local or in your personal cloud account. You can export it to CSV tomorrow if you want to switch platforms. Plus, spreadsheets allow for custom calculations-like calculating profit margins on sold items or visualizing spending trends by year-that most consumer apps don’t offer out of the box.
| Feature | Spreadsheet (Excel/Sheets) | Dedicated App (e.g., CLZ Games) |
|---|---|---|
| Data Ownership | Full ownership; easy export to CSV/XLSX | Limited; often requires subscription to export |
| Customization | Unlimited columns and formulas | Fixed fields defined by developer |
| Cost | Free (Google/LibreOffice) or included in Office 365 | Often $15-$40 one-time fee or subscription |
| Automation | Power Query, Scripts, Live Web Imports | Barcode scanning only |
Choosing Your Platform
The first decision is which software to use. For most collectors, the choice comes down to two giants: Microsoft Excel is a powerful desktop spreadsheet application known for advanced data analysis features like Power Query and Pivot Tables. and Google Sheets is a free, web-based spreadsheet program that offers real-time collaboration and automatic cloud saving.
- Google Sheets: Best for beginners and those who want zero setup. It’s free, saves automatically, and works on any device with a browser. If you share your collection status with friends or need to access it from your phone while at a garage sale, this is your pick.
- Microsoft Excel: Best for power users. If you have a large collection (500+ games) and want to use advanced features like Power Query to pull live prices from websites, Excel is superior. It handles complex formulas faster and has more robust charting options.
- LibreOffice Calc / Apple Numbers: Solid free alternatives if you prefer open-source software or are deep in the Apple ecosystem. They work well for basic inventories but lack some of the advanced automation connectors found in Excel.
Designing the Data Model: Essential Columns
A common mistake is creating separate sheets for each console (one for NES, one for PS2). Don’t do this. It makes analyzing your total collection nearly impossible. Instead, use a single "Master Table" where every row is one physical or digital item.
Start with these essential columns. Keep them consistent so your formulas work correctly later.
- ID: A unique number for each entry (1, 2, 3...). This helps you reference specific items in notes or photos.
- Title: The full name of the game.
- Platform: Use standard abbreviations (NES, SNES, PS1, Switch). We will set up drop-downs for this later to prevent spelling errors.
- Region: NTSC-U (US), PAL (Europe), NTSC-J (Japan). Crucial for retro collectors, as region-locked consoles require matching cartridges/discs.
- Condition: Loose, CIB (Complete in Box), New/Sealed. This drastically affects value.
- Purchase Date: When did you buy it?
- Purchase Price: How much did you pay? Include tax if you want accurate cost basis.
- Source: eBay, Local Game Store, Garage Sale, Friend.
- Location: Where is it stored? (e.g., "Shelf B, Row 2"). This saves time when looking for a game to play or sell.
- Notes: Any quirks, missing manuals, or reasons you kept it.

Enforcing Consistency with Data Validation
If you type "PS2", "PlayStation 2", and "Sony PS2" across different rows, your summary reports will fail. To fix this, use Data Validation to create drop-down menus.
In Excel or Google Sheets:
- Create a new sheet called "Lists".
- In column A, list all your platforms (NES, SNES, N64, PS1, etc.).
- In column B, list conditions (Loose, CIB, Sealed).
- Go back to your Master Table. Select the entire "Platform" column.
- Go to Data > Data Validation (or Data > Validation Rules in Sheets).
- Set the criteria to "List from range" and select your platform list from the "Lists" sheet.
Now, when you click a cell in the Platform column, a drop-down appears. This ensures clean data, which is the foundation of any good database.
Tracking Value: Manual vs. Automated
The hardest part of collecting is knowing what your stuff is worth. Prices fluctuate. A game worth $10 in 2020 might be $25 today. You have two main approaches to tracking this.
Method 1: The Annual Snapshot (Simple)
This is the method recommended by veteran collector retro-room. Once a year, you visit PriceCharting.com is a comprehensive database that tracks historical sales and current market values for video games, cards, and other collectibles., look up each game, and enter the current average price into a new column labeled "Value [Year]" (e.g., "Value 2025").
Pros: Easy, no technical skills required.
Cons: Time-consuming for large collections; values become stale quickly.
Method 2: Power Query Automation (Advanced)
If you use Microsoft Excel on Windows, you can automate this. Using a feature called Power Query is an Excel tool that allows users to connect to external data sources, transform data, and load it into the spreadsheet automatically., you can build a URL for each game that points to its PriceCharting page. Excel then fetches the HTML, extracts the price, and updates your sheet with one click.
While setting this up takes a few hours of learning (watching tutorials on "Excel Power Query From Web" is helpful), it pays off. You can refresh your entire collection’s value in seconds rather than hours. Note: Always check the terms of service of price sites before scraping data automatically.
Calculating Statistics with Formulas
Once your data is entered, let the spreadsheet do the math. Here are the essential formulas every collector needs.
Total Collection Cost:
Use the SUM function to add up your purchase prices. If your prices are in column H, starting at row 2:
=SUM(H:H)
Total Current Market Value:
Sum the column where you track current values (let’s say Column I):
=SUM(I:I)
Unrealized Gain/Loss:
Subtract total cost from total value to see if your collection is an appreciating asset.
=SUM(I:I) - SUM(H:H)
Games Per Platform:
Use COUNTIF to see how many games you own per system. If your platform list is in Column B:
=COUNTIF(B:B, "SNES")
Average Spend Per Game:
Divide total spend by the count of games.
=AVERAGE(H:H)
For deeper analysis, use a Pivot Table. Highlight your data, go to Insert > Pivot Table, and drag "Platform" to Rows and "Purchase Price" to Values. Instantly, you’ll see a breakdown of how much you’ve spent on each console. This often reveals surprising habits, like overspending on a system you rarely play.
Maintenance and Risk Management
A spreadsheet is only useful if it’s accurate. Set a routine.
- Log Immediately: Enter new purchases within 24 hours. Relying on memory leads to lost receipts and forgotten details.
- Annual Audit: Once a year, print your inventory or view it on a tablet. Walk through your shelves physically. Verify every game exists. Mark any lost or sold items. This prevents "phantom inventory" where you think you own something you actually sold five years ago.
- Backup Religiously: If using Excel, save a copy to OneDrive or an external hard drive. If using Google Sheets, it auto-saves, but still download a CSV backup occasionally. Protect yourself against account lockouts or hardware failure.
- Photos for Insurance: Spreadsheets prove value; photos prove existence. Take clear pictures of high-value items and your shelves. Store these photos in a separate cloud folder linked in your spreadsheet notes.
Scaling Up: When to Move Beyond Basics
If your collection grows beyond 2,000 items, simple formulas might slow down. At this stage, consider integrating with online databases like Vgcollect.com is a free online database for video game collectors to log and manage their collections. for metadata (cover art, release dates) while keeping your spreadsheet for financial tracking. Export data from Vgcollect to CSV, import it into your sheet, and use VLOOKUP or XLOOKUP to merge the datasets. This hybrid approach gives you the best of both worlds: rich visual data and powerful financial analysis.
Is it better to use Excel or Google Sheets for my game collection?
It depends on your needs. Use Google Sheets if you want simplicity, free access, and the ability to update your list from your phone while shopping. Use Microsoft Excel if you have a large collection (500+ items) and want to use advanced features like Power Query to automate price updates or create complex pivot tables for financial analysis.
How do I find the current value of my retro games?
The most reliable source for retro game values is PriceCharting.com. It aggregates actual sales data to provide average prices for loose, complete, and sealed conditions. You can manually look up prices annually or use Excel’s Power Query feature to automate fetching this data if you are technically inclined.
Should I keep separate sheets for each console?
No. Keeping everything in one master table allows you to calculate total collection value and analyze spending across all platforms easily. Use filters or Pivot Tables to view data by individual console when needed. Separate sheets make overall analysis difficult and prone to error.
What columns are absolutely necessary in my inventory?
At minimum, include Title, Platform, Condition, Purchase Date, Purchase Price, and Source. Adding a Location column (where the game is stored) and a Notes column is highly recommended for long-term maintenance and insurance purposes.
Can I automate adding games to my spreadsheet?
Not directly from most stores, but you can streamline the process. Some collectors use barcode scanner apps on their phones that output text, which they then paste into their spreadsheet. Others export transaction histories from eBay or PayPal and merge that data into their sheet using VLOOKUP functions to match purchases with game titles.